> ## Documentation Index
> Fetch the complete documentation index at: https://docs.meetsquad.ai/llms.txt
> Use this file to discover all available pages before exploring further.
# Insights
> Transform data into actionable product decisions with AI-powered insights
 ## Overview
Squad Insights aggregates data from all your connected tools and imported feedback to surface what matters most. Our AI analyzes customer feedback, product analytics, support tickets, and more to help you make data-driven decisions that move your metrics.
Insights automatically updates as new data flows in from your connected tools, ensuring you're always working with the latest information.
## Key capabilities
See all your product metrics in one place
AI categorizes and prioritizes user feedback
Spot emerging patterns before they become problems
Understand which issues affect the most users
Monitor how users feel about your product over time
Real-time progress on all your strategic goals
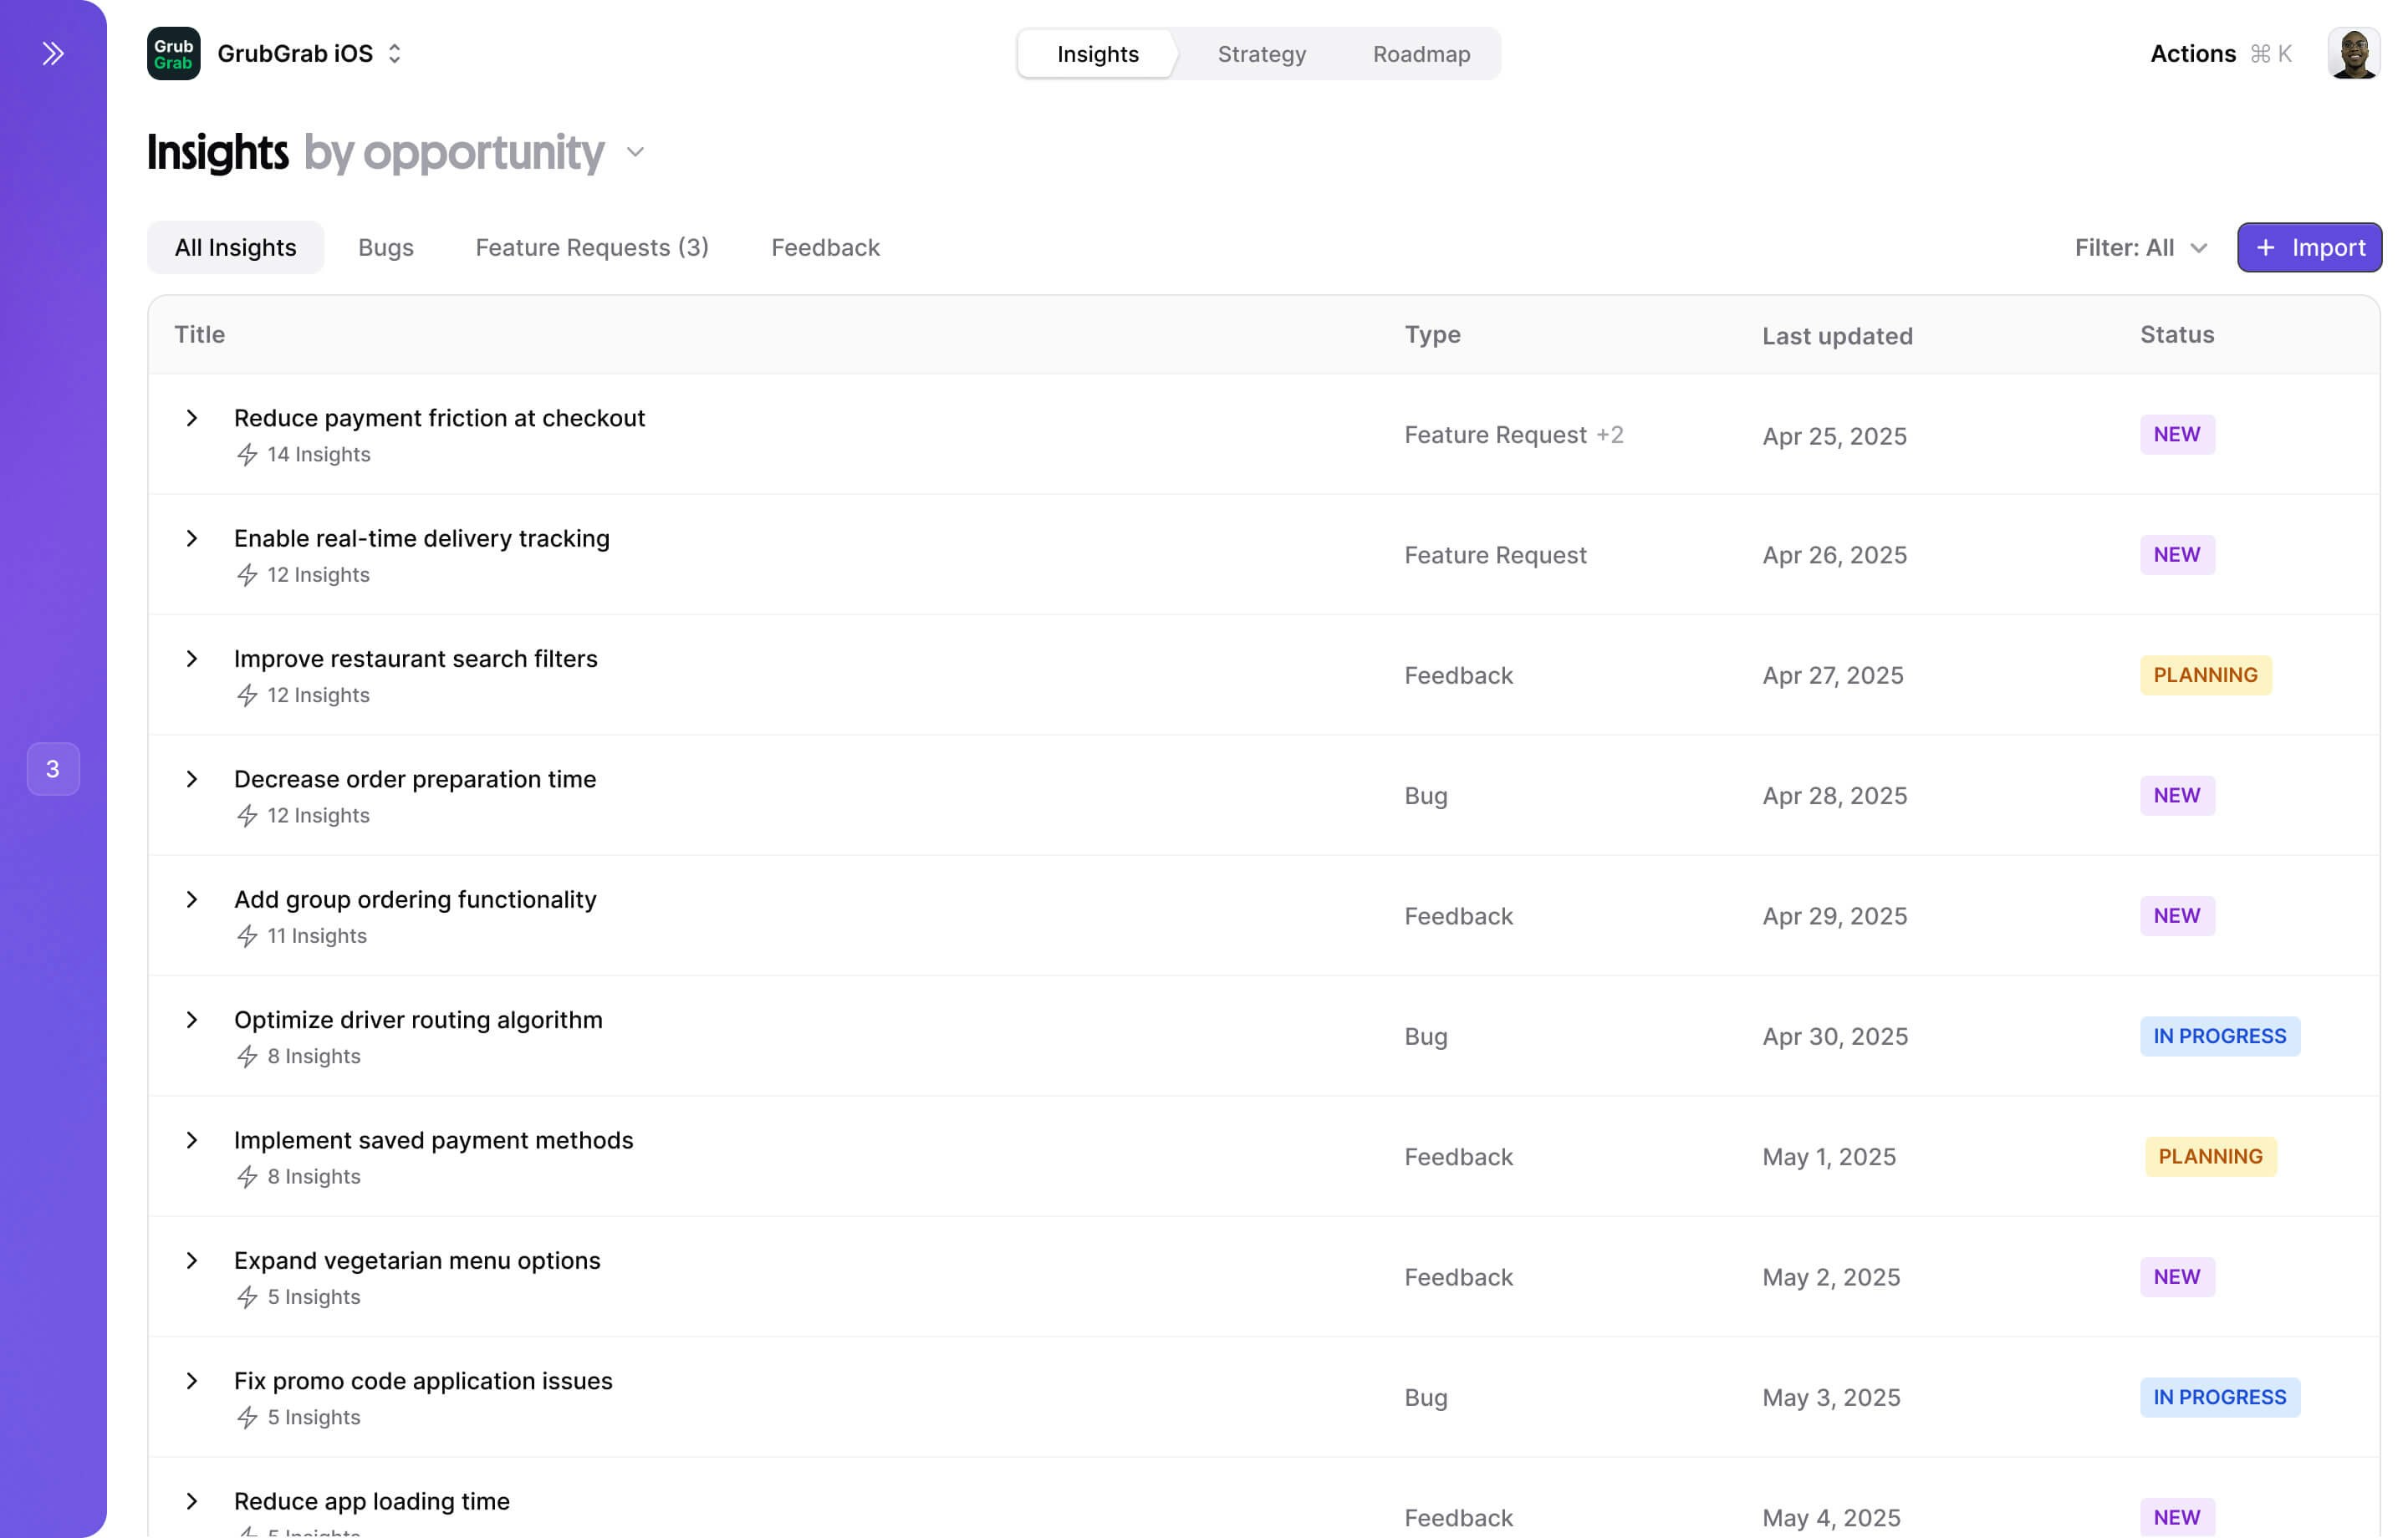
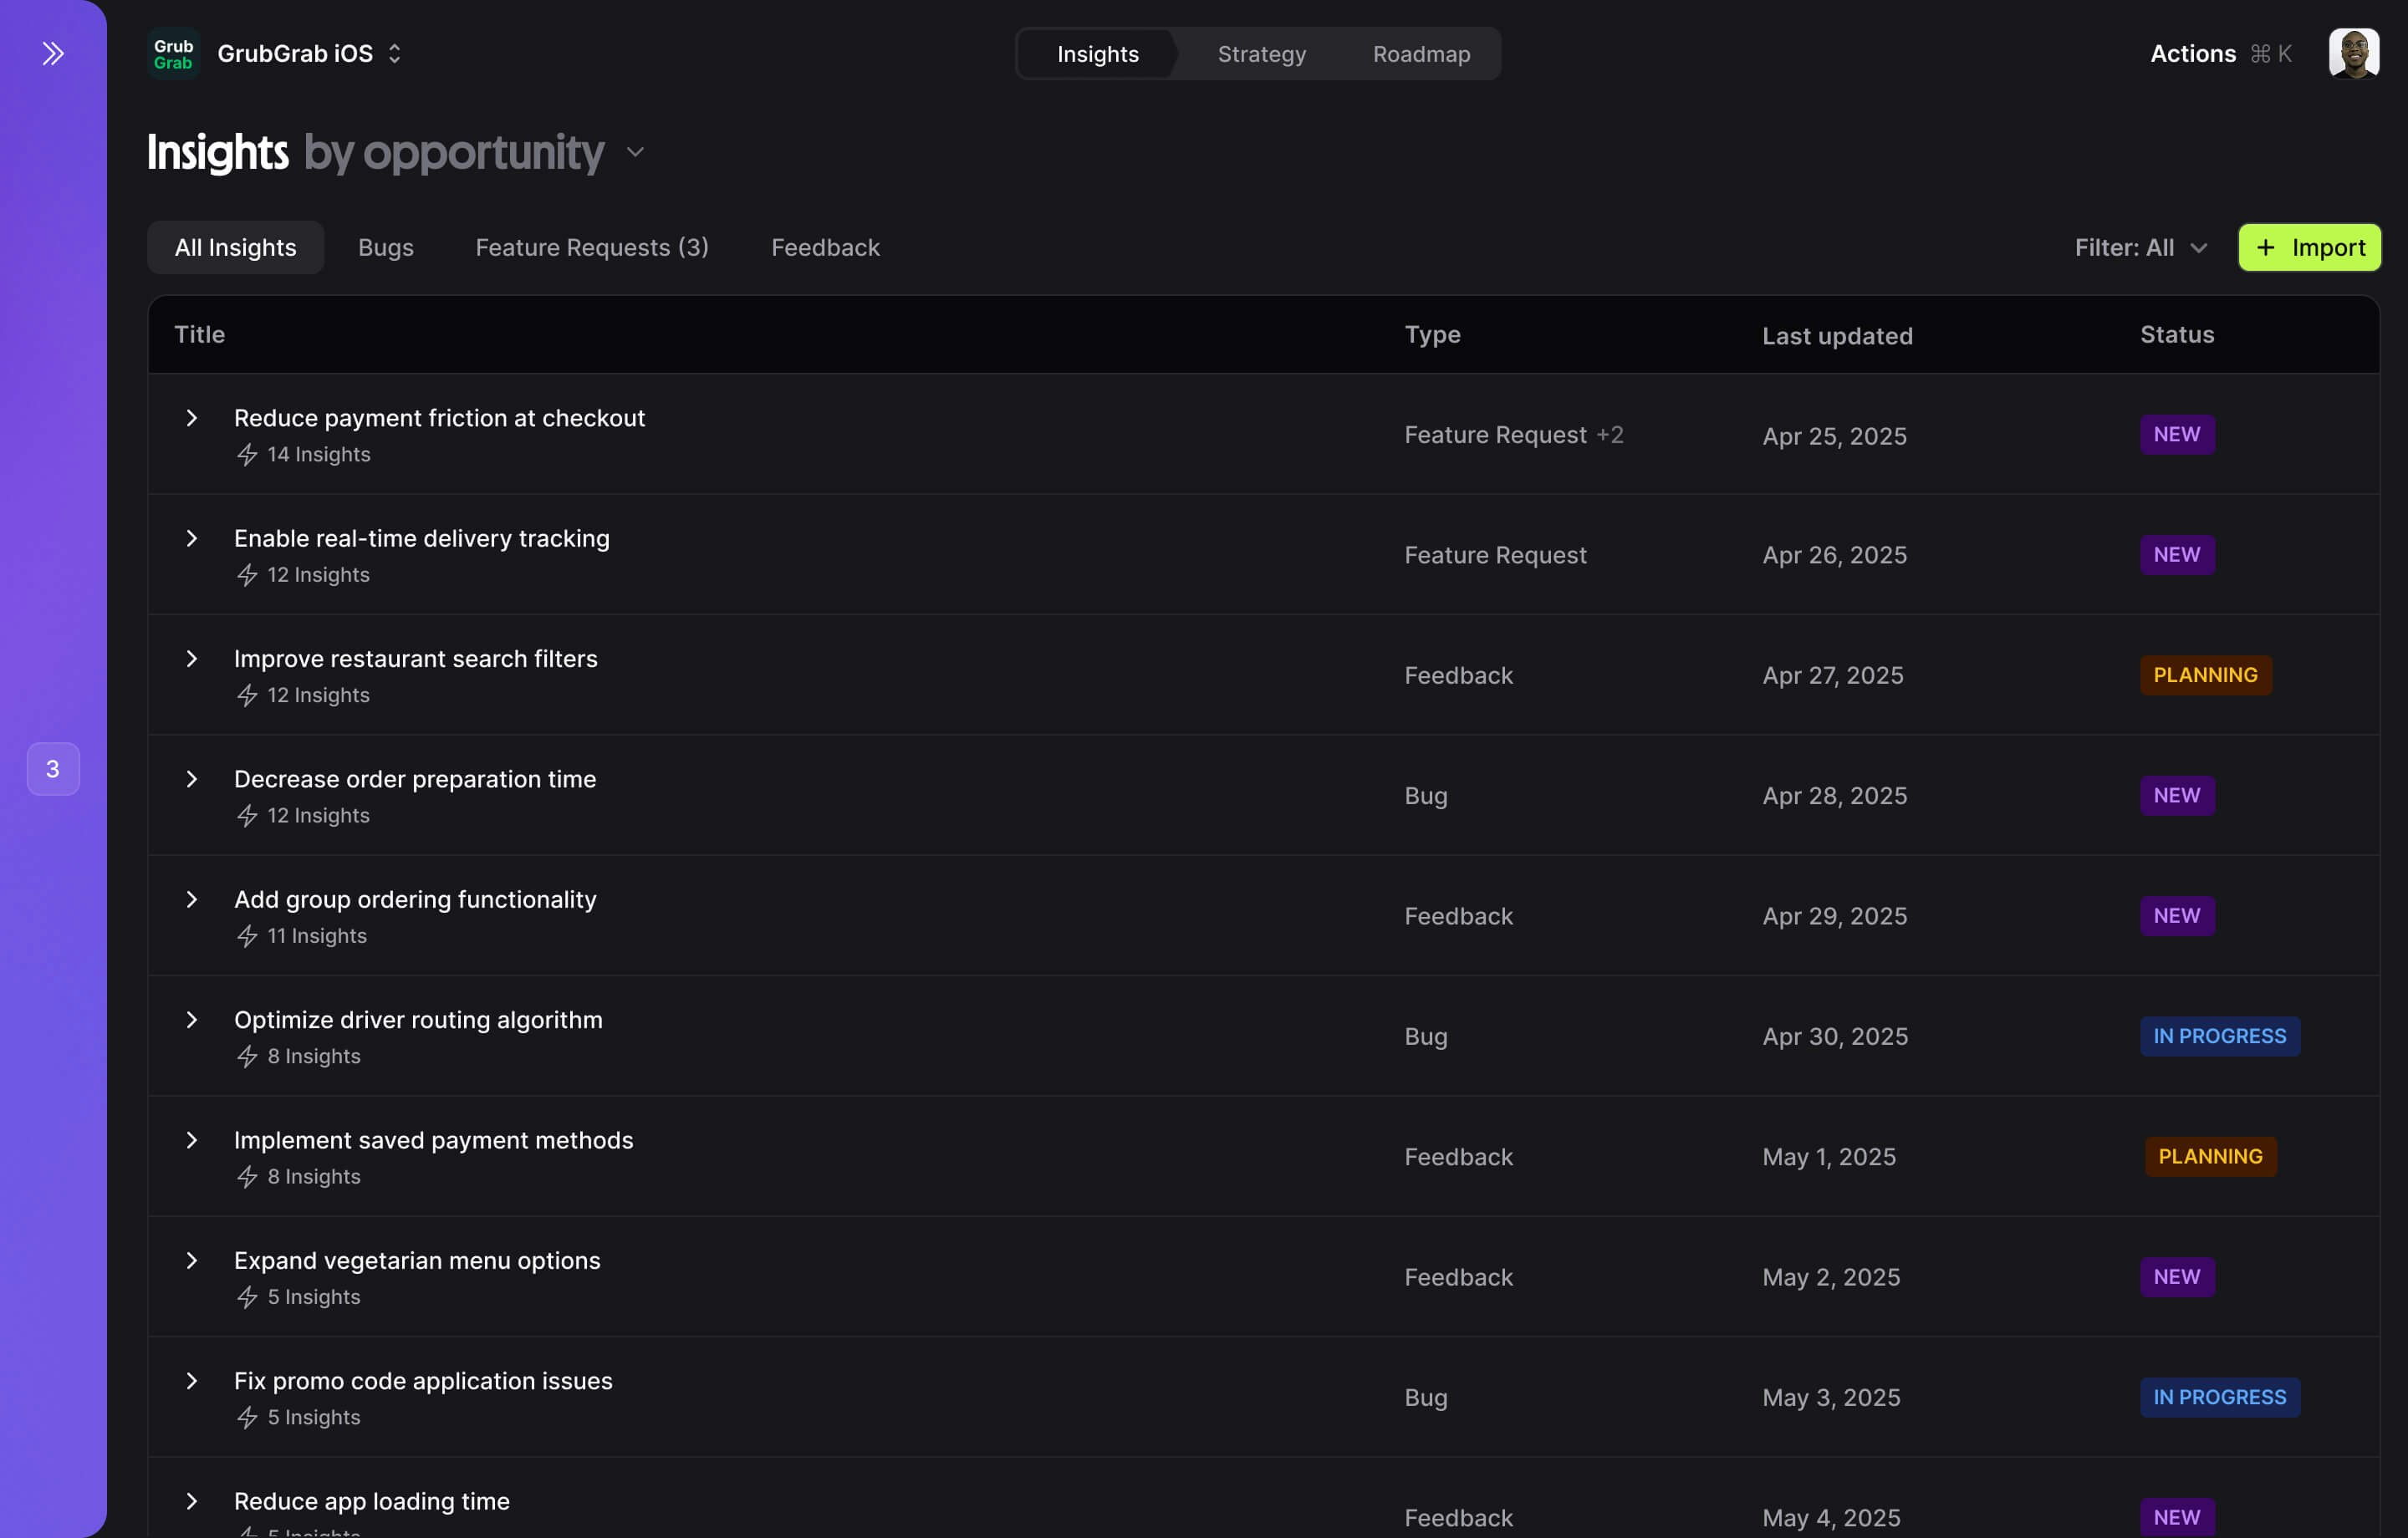
## Insights interface
The Insights page header includes a "Discover Insights" dropdown selector along with two action buttons in the top-right:
* **"+ Add Knowledge"** — Add business context, documents, or data to enrich your insights
* **"+ Discover Insights"** (purple) — Run AI-powered discovery to surface new insights from your connected data
You can also use the **search bar** to find specific insights, and click **"+ Add filter"** to narrow results by source, topic, sentiment, or other criteria.
## Creating insights
1. Click the **"+ Discover Insights"** button from the Insights page, or **"+ Add Knowledge"** to add context first.
## Overview
Squad Insights aggregates data from all your connected tools and imported feedback to surface what matters most. Our AI analyzes customer feedback, product analytics, support tickets, and more to help you make data-driven decisions that move your metrics.
Insights automatically updates as new data flows in from your connected tools, ensuring you're always working with the latest information.
## Key capabilities
See all your product metrics in one place
AI categorizes and prioritizes user feedback
Spot emerging patterns before they become problems
Understand which issues affect the most users
Monitor how users feel about your product over time
Real-time progress on all your strategic goals
## Insights interface
The Insights page header includes a "Discover Insights" dropdown selector along with two action buttons in the top-right:
* **"+ Add Knowledge"** — Add business context, documents, or data to enrich your insights
* **"+ Discover Insights"** (purple) — Run AI-powered discovery to surface new insights from your connected data
You can also use the **search bar** to find specific insights, and click **"+ Add filter"** to narrow results by source, topic, sentiment, or other criteria.
## Creating insights
1. Click the **"+ Discover Insights"** button from the Insights page, or **"+ Add Knowledge"** to add context first.
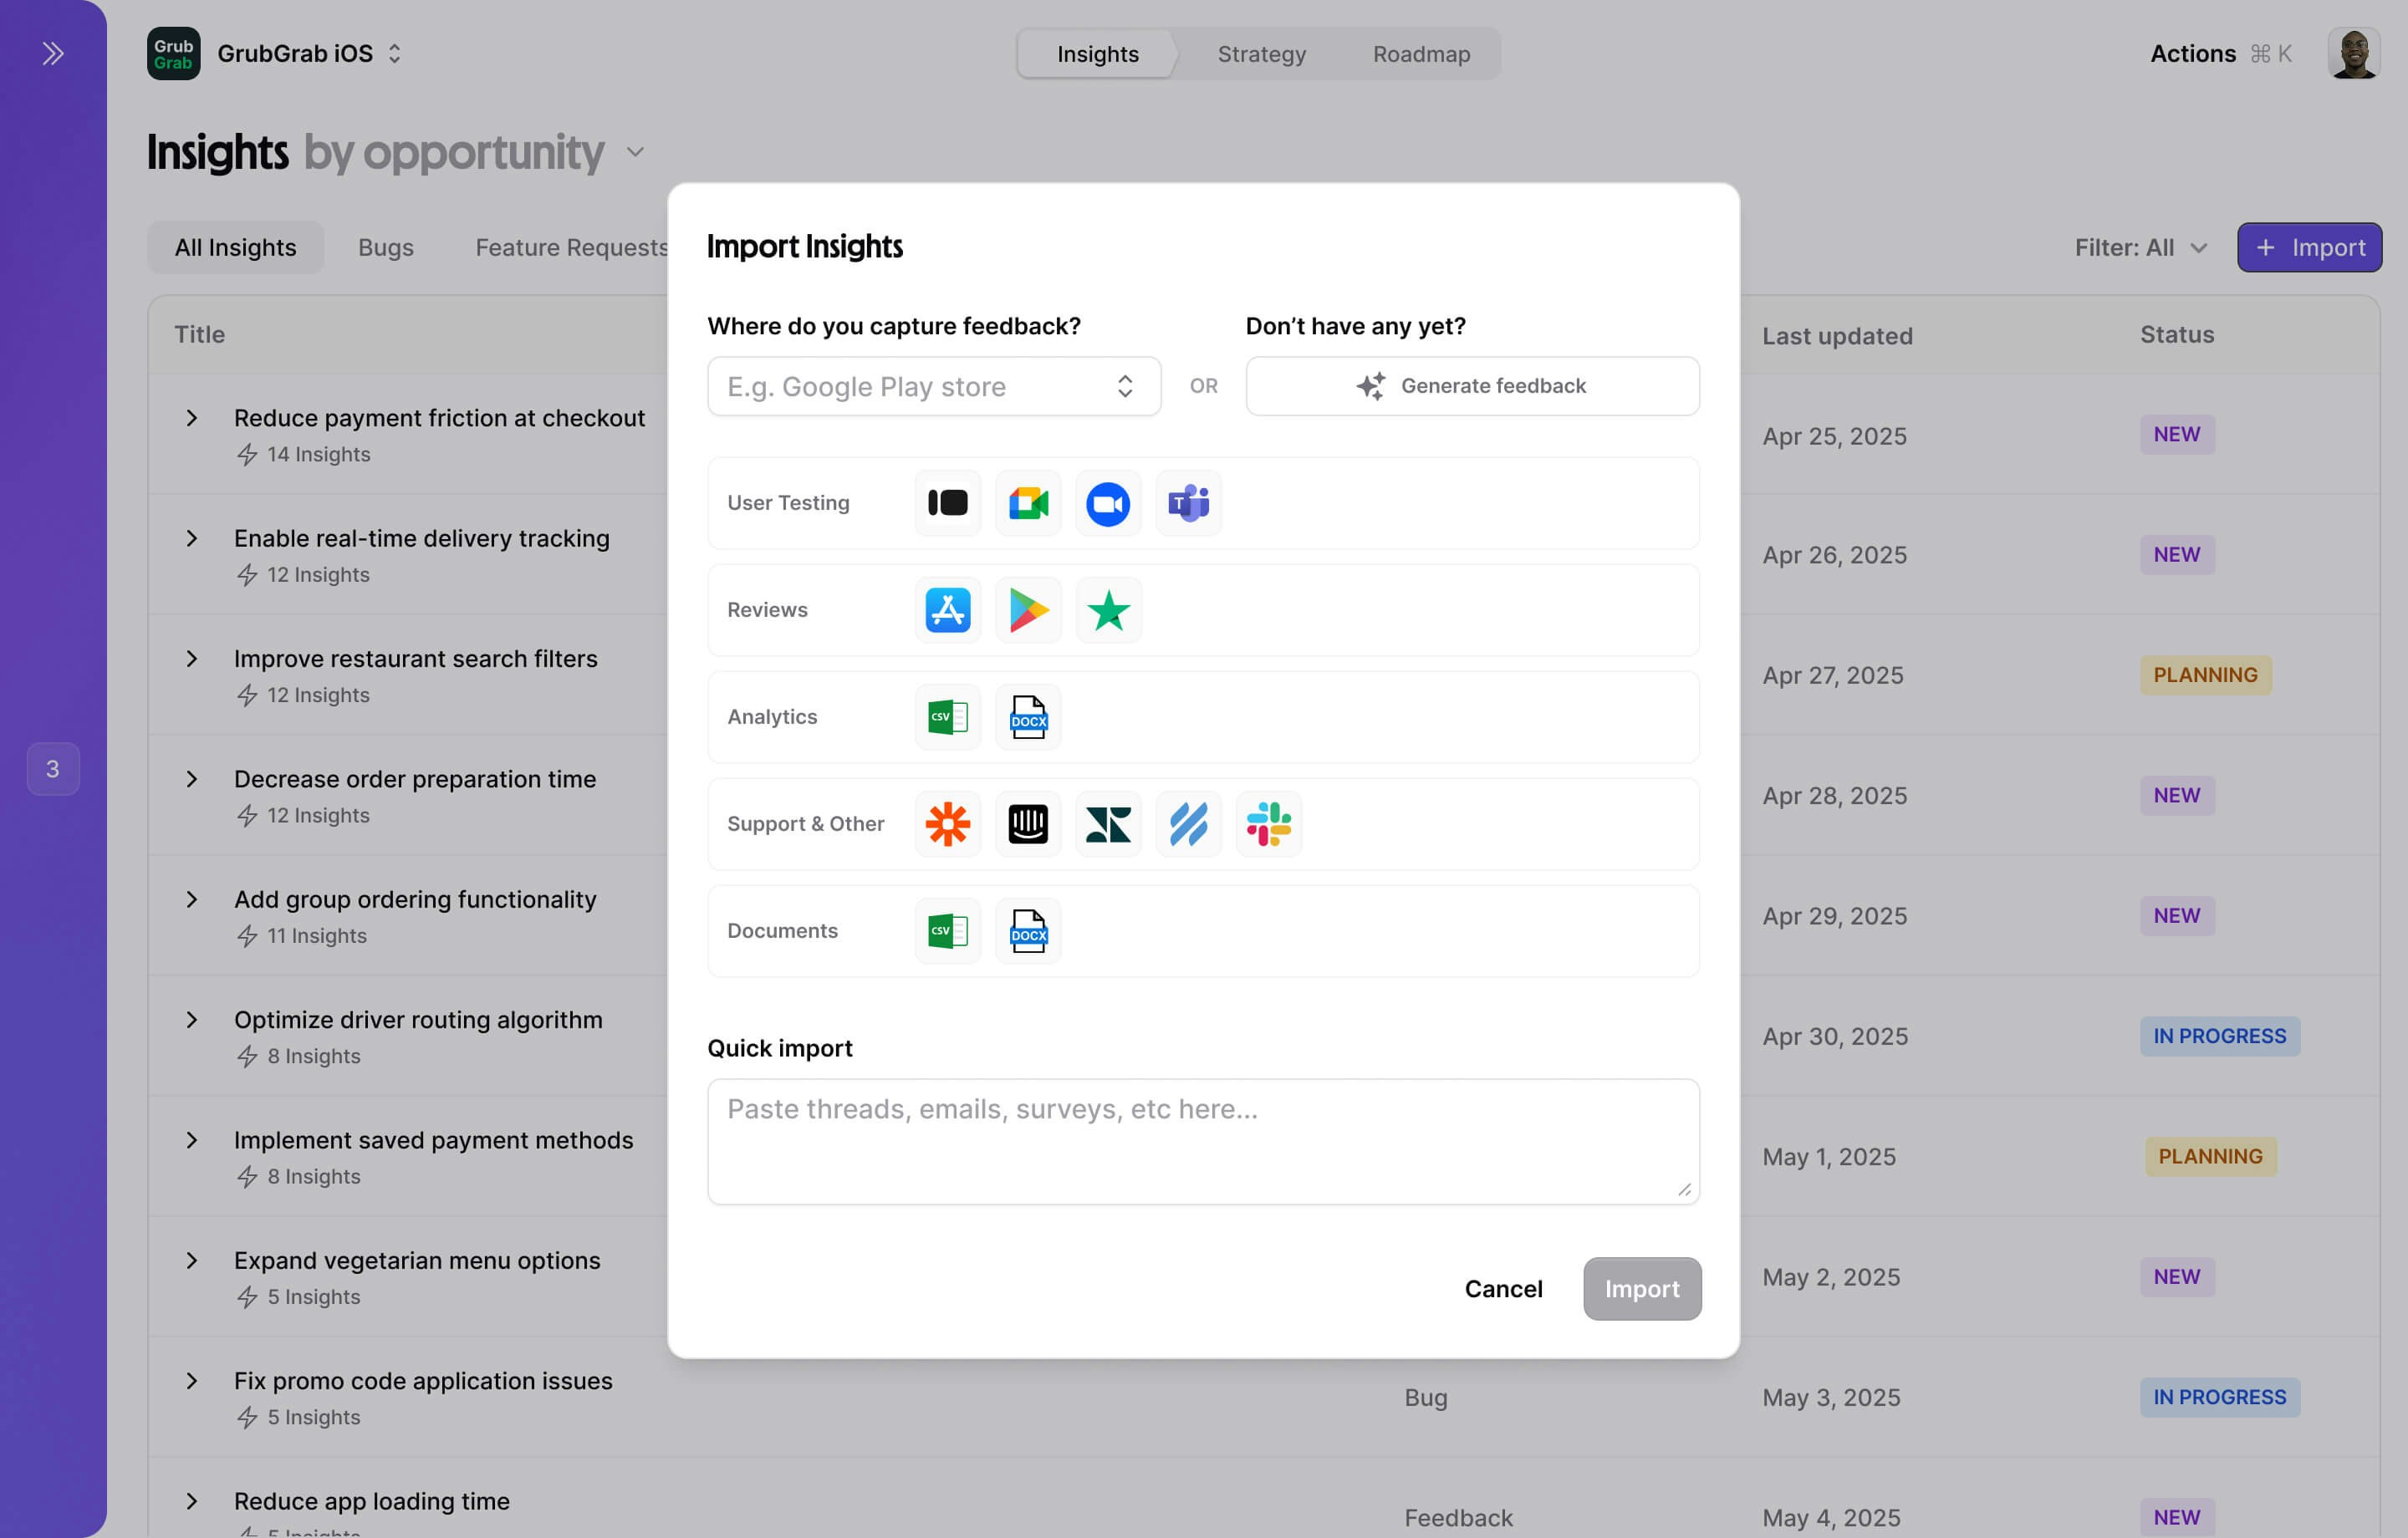
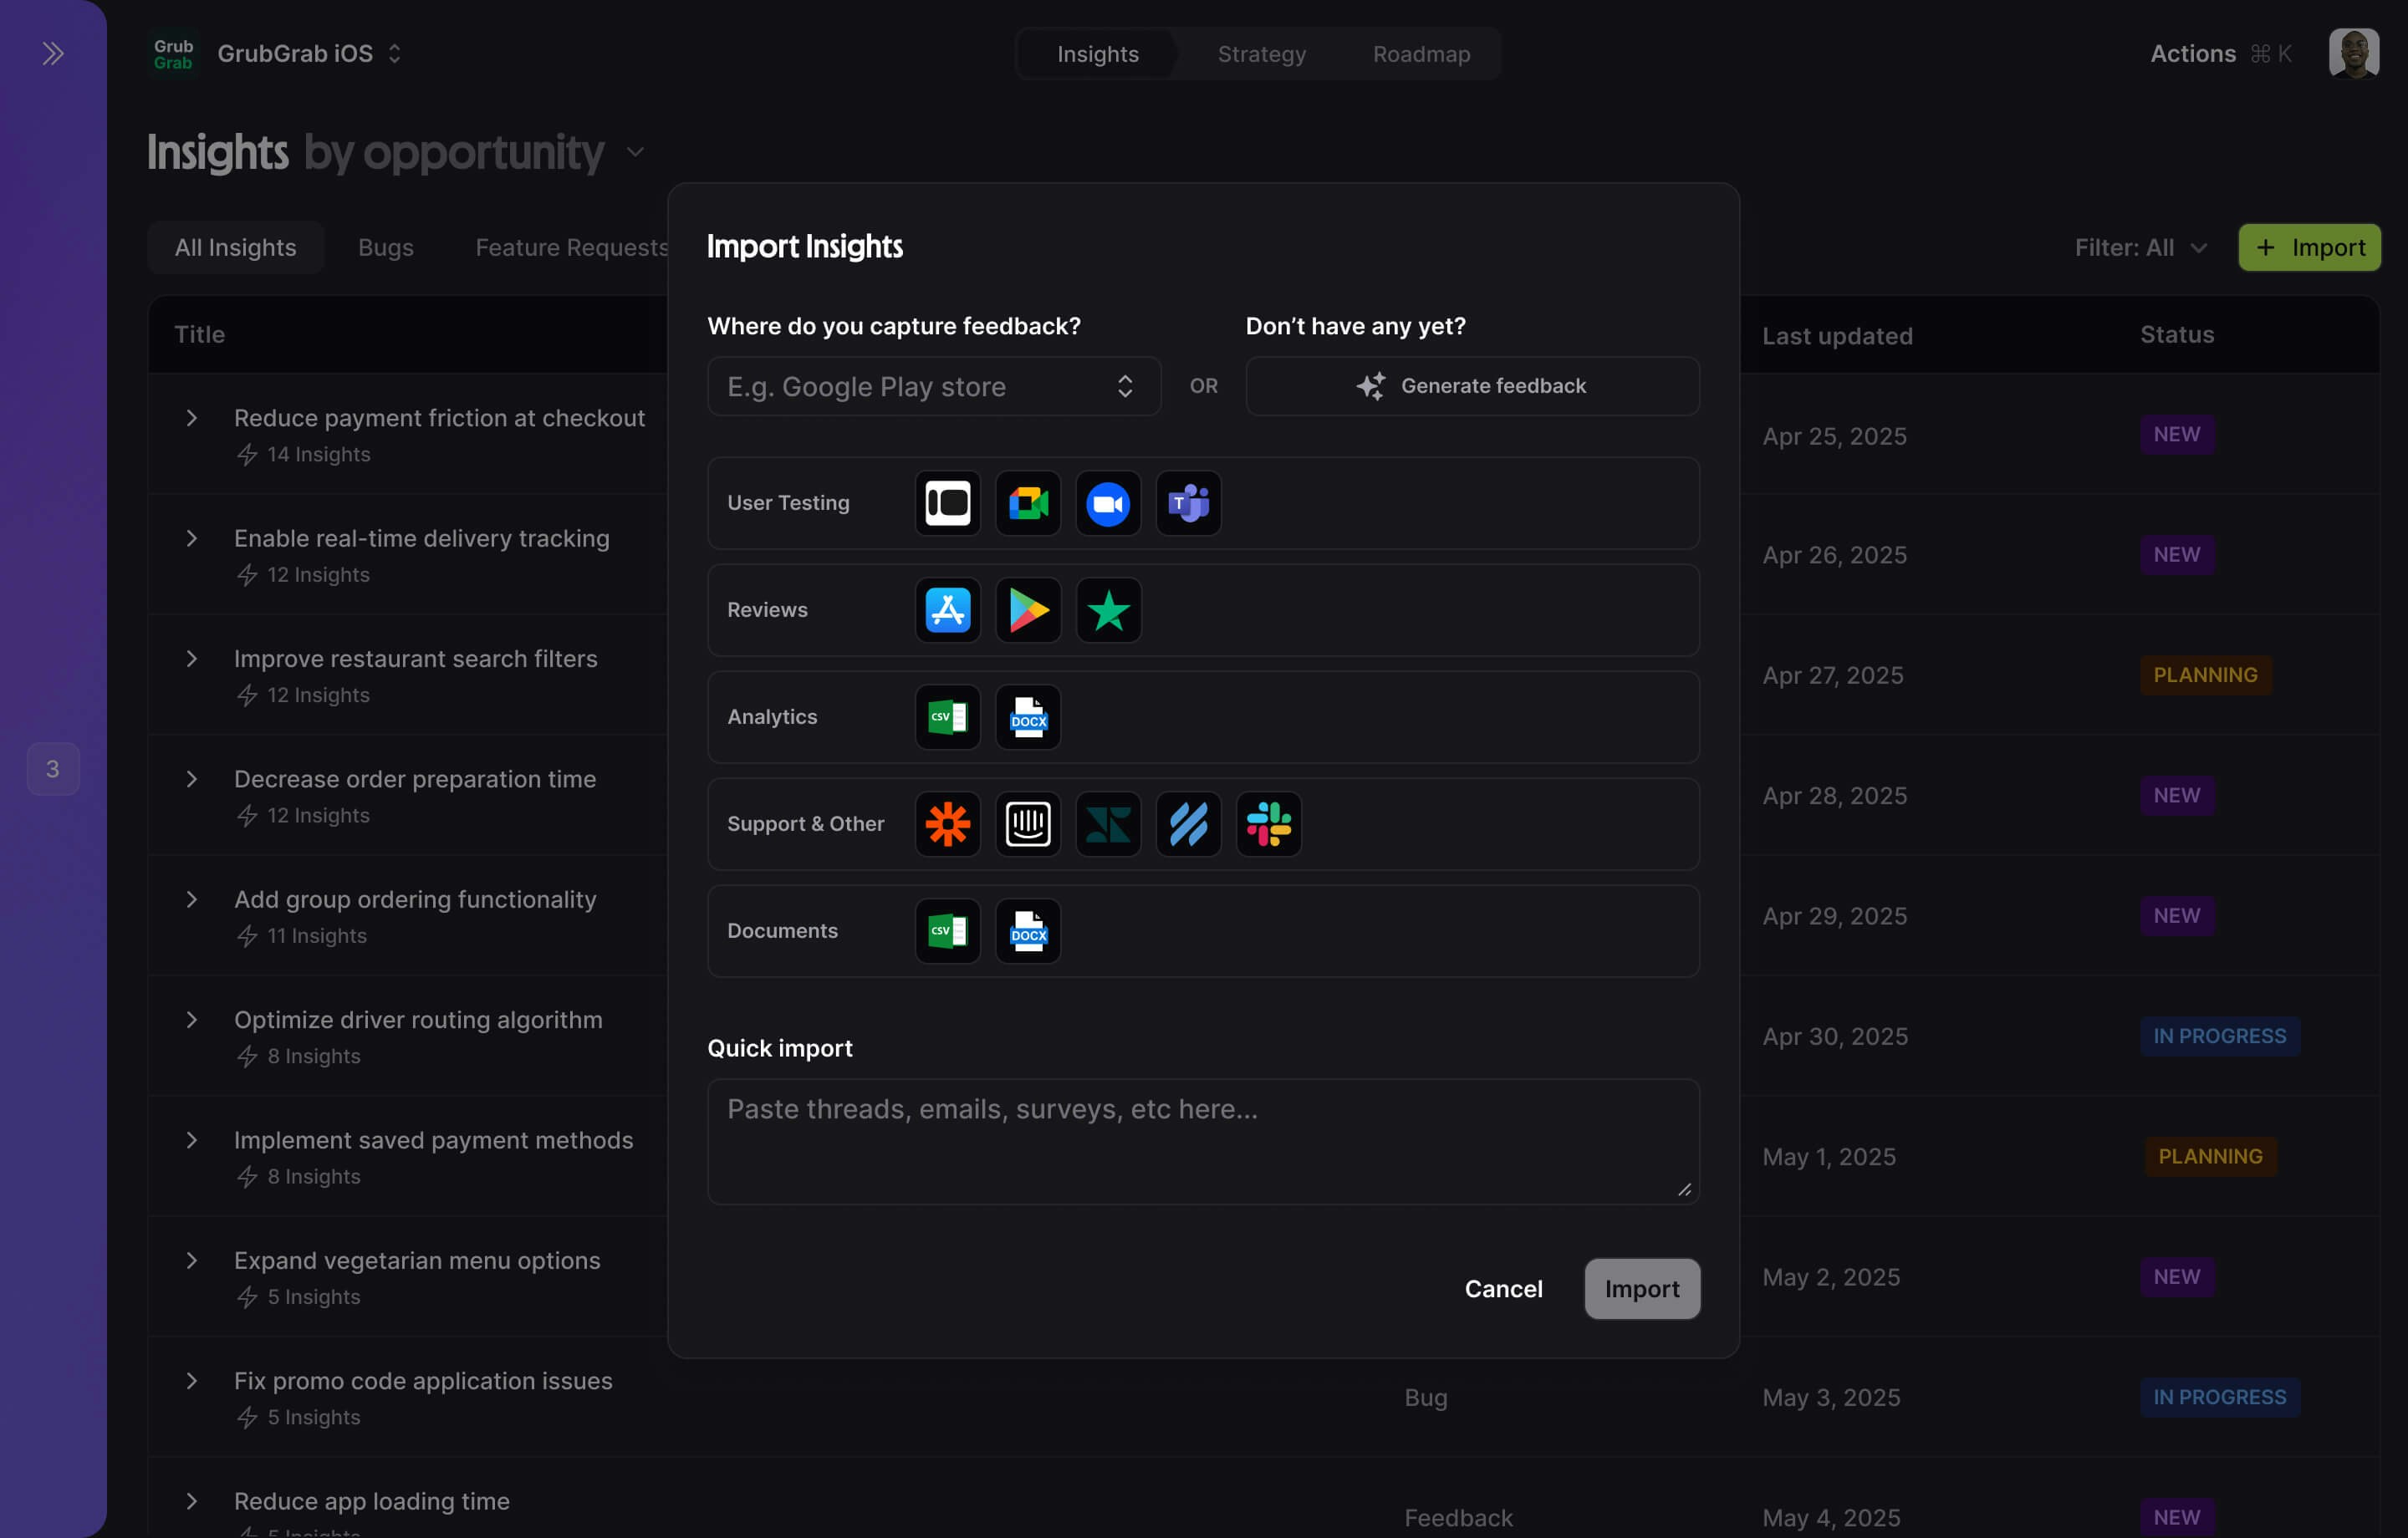 2. Select an existing integration, add a new one, or import by pasting the feedback directly into Squad.
If you don't have any analytical data or customer feedback, you can generate some using the "Generate feedback" button instead.
3. Let your Squad analyse the data, cluster it into a new or existing topic, and then surface any opportunities from it.
Insights automatically updates as new data flows in from your connected tools, ensuring you're always working with the latest information.
## Data sources
Squad Insights pulls from multiple sources to give you a complete picture:
Connect your product analytics to track user behavior and metrics:
* **Amplitude (enterprise plans only)** - User paths, cohorts, experiments
* **Google Analytics (enterprise plans only)** - Traffic, conversions, user flow
* More coming soon!
Squad automatically maps your existing events to common product metrics like activation, retention, and engagement.
Aggregate qualitative feedback from every channel:
* **Support tickets** - Zendesk, Intercom, Freshdesk
* **App reviews** - App Store, Google Play ratings
* **Surveys** - Typeform, SurveyMonkey, NPS tools
* **User interviews** - Transcripts from Zoom, Gong
* **Community** - Discord, Slack, Reddit mentions
Squad's AI reads between the lines to surface what users really want, not just what they say.
Incorporate your team's knowledge:
* **CRM data** - Salesforce, HubSpot customer info
* **Task tracking** - Jira, Linear, Asana progress
* **Communication** - Slack discussions, email threads
* **Documentation** - Notion, Confluence pages
* **Code repositories** - GitHub, GitLab activity
## How insights work
The Insights page is your command center for understanding what's going on with your product:
### Feedback topics
Squad uses natural language processing to automatically:
1. **Extract key topics** from unstructured feedback
2. **Group similar issues** even when described differently
3. **Calculate impact** based on frequency and user segments
4. **Track sentiment** to understand urgency
5. **Link to goals** showing which themes affect your metrics
For example, "app crashes during checkout", "payment screen freezes", and "can't complete order" would all be grouped under "Checkout stability issues".
### Opportunity discovery
Squad automatically surfaces high-impact opportunities:
1. **Data aggregation** combines quantitative metrics with qualitative feedback
2. **Impact analysis** calculates potential improvement to your goals
3. **Effort estimation** estimates implementation complexity based on similar projects
4. **Priority scoring** ranks opportunities by impact/effort ratio
### Example workflow
Squad makes it easy to turn insights into roadmap items:
Notice checkout completion dropped 10% this week
Click into the Insight to see correlated feedback topics
Click into Opportunities to see what is actionable
Let Squad AI suggest fixes based on the data
Add the solution to your next sprint
## Best practices
The more data Squad has, the better its insights. Don't leave blind spots.
Make Insights review a regular ritual to catch trends early
Create opportunities directly from insights to maintain momentum
Export dashboards for stakeholders who don't use Squad daily
## Other features
Ask questions about your insights in natural language
Turn insights into opportunities and solutions
Prioritize work based on data-driven insights
2. Select an existing integration, add a new one, or import by pasting the feedback directly into Squad.
If you don't have any analytical data or customer feedback, you can generate some using the "Generate feedback" button instead.
3. Let your Squad analyse the data, cluster it into a new or existing topic, and then surface any opportunities from it.
Insights automatically updates as new data flows in from your connected tools, ensuring you're always working with the latest information.
## Data sources
Squad Insights pulls from multiple sources to give you a complete picture:
Connect your product analytics to track user behavior and metrics:
* **Amplitude (enterprise plans only)** - User paths, cohorts, experiments
* **Google Analytics (enterprise plans only)** - Traffic, conversions, user flow
* More coming soon!
Squad automatically maps your existing events to common product metrics like activation, retention, and engagement.
Aggregate qualitative feedback from every channel:
* **Support tickets** - Zendesk, Intercom, Freshdesk
* **App reviews** - App Store, Google Play ratings
* **Surveys** - Typeform, SurveyMonkey, NPS tools
* **User interviews** - Transcripts from Zoom, Gong
* **Community** - Discord, Slack, Reddit mentions
Squad's AI reads between the lines to surface what users really want, not just what they say.
Incorporate your team's knowledge:
* **CRM data** - Salesforce, HubSpot customer info
* **Task tracking** - Jira, Linear, Asana progress
* **Communication** - Slack discussions, email threads
* **Documentation** - Notion, Confluence pages
* **Code repositories** - GitHub, GitLab activity
## How insights work
The Insights page is your command center for understanding what's going on with your product:
### Feedback topics
Squad uses natural language processing to automatically:
1. **Extract key topics** from unstructured feedback
2. **Group similar issues** even when described differently
3. **Calculate impact** based on frequency and user segments
4. **Track sentiment** to understand urgency
5. **Link to goals** showing which themes affect your metrics
For example, "app crashes during checkout", "payment screen freezes", and "can't complete order" would all be grouped under "Checkout stability issues".
### Opportunity discovery
Squad automatically surfaces high-impact opportunities:
1. **Data aggregation** combines quantitative metrics with qualitative feedback
2. **Impact analysis** calculates potential improvement to your goals
3. **Effort estimation** estimates implementation complexity based on similar projects
4. **Priority scoring** ranks opportunities by impact/effort ratio
### Example workflow
Squad makes it easy to turn insights into roadmap items:
Notice checkout completion dropped 10% this week
Click into the Insight to see correlated feedback topics
Click into Opportunities to see what is actionable
Let Squad AI suggest fixes based on the data
Add the solution to your next sprint
## Best practices
The more data Squad has, the better its insights. Don't leave blind spots.
Make Insights review a regular ritual to catch trends early
Create opportunities directly from insights to maintain momentum
Export dashboards for stakeholders who don't use Squad daily
## Other features
Ask questions about your insights in natural language
Turn insights into opportunities and solutions
Prioritize work based on data-driven insights